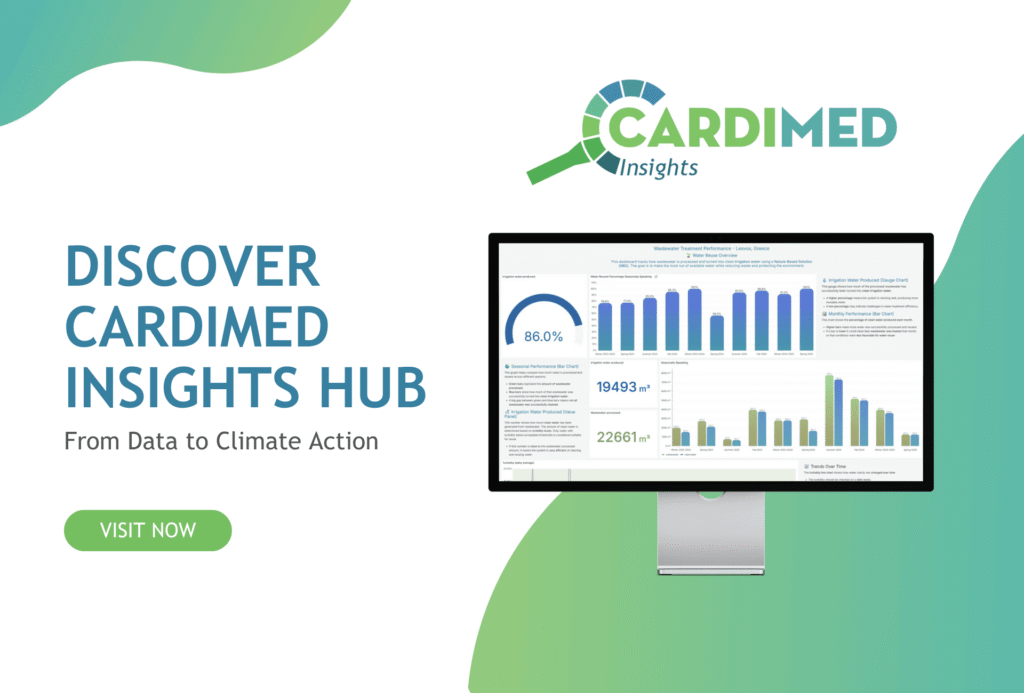
In today’s data-driven landscape, transparency, accessibility, and engagement are essential pillars of climate resilience. That’s where CARDIMED Insights comes in—an open, user-friendly platform that brings critical environmental data to life through intuitive dashboards.
Developed within the CARDIMED project, the platform provides a 360-degree view of climate resilience, combining indicators from diverse domains such as weather, air quality, and Nature-Based Solution (NbS) performance. Its goal? To enable both citizens and regional authorities to make better-informed decisions, co-create solutions, and monitor progress toward a sustainable Mediterranean.
Insights for World Impact
CARDIMED Insights serves as a central intelligence hub across CARDIMED’s demonstration sites. Each dashboard is designed to visualise specific environmental indicators, making complex datasets comprehensible for non-experts while remaining useful for technical audiences.
To illustrate its capabilities, let’s explore the implementation in sub‑DEMO 1.1 (Lesvos, Greece), where an NBS has been deployed.
Example: Sub-DEMO 1.1 – Lesvos, Greece
On the island of Lesvos, Greece, CARDIMED supported the creation of a treatment system that transforms wastewater into reclaimed water, reused for irrigation in nearby agroforestry fields. To assess and communicate its performance, three interlinked dashboards were developed on the CARDIMED Insights platform:
1.Wastewater Treatment Performance

Figure 1: Wastewater Treatment Performance
This dashboard tracks key metrics, including irrigation water production, turbidity, and other indicators of treatment efficiency. It enables stakeholders to:
- Monitor performance over time
- Validate compliance with treatment goals
- Understand how reclaimed water supports circular water use
By visualising key metrics, the platform enhances transparency, supports data-informed water management, and strengthens trust in local infrastructure.
2.Weather Highlights
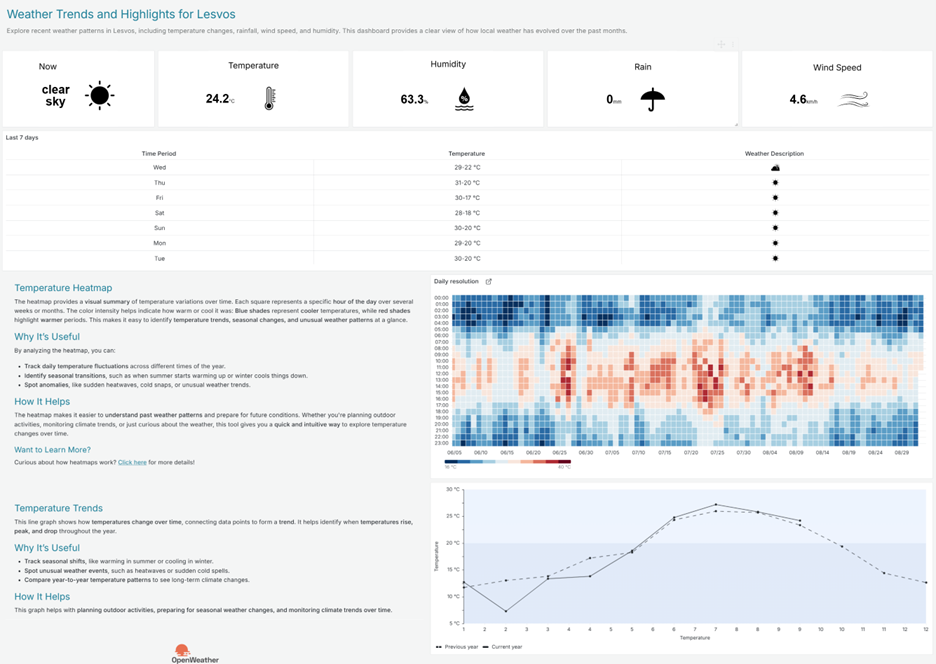
Figure 2: Weather Highlights
Designed to convey essential weather conditions at a glance, this dashboard includes temperature, humidity, precipitation, and wind trends. It helps communities understand:
- Current conditions.
- Seasonal fluctuations and anomalies.
- Insights to support preparedness and community resilience.
Informed citizens become empowered citizens, knowing when to conserve water, prepare for heatwaves, or adapt daily plans to changing weather.
Air Quality
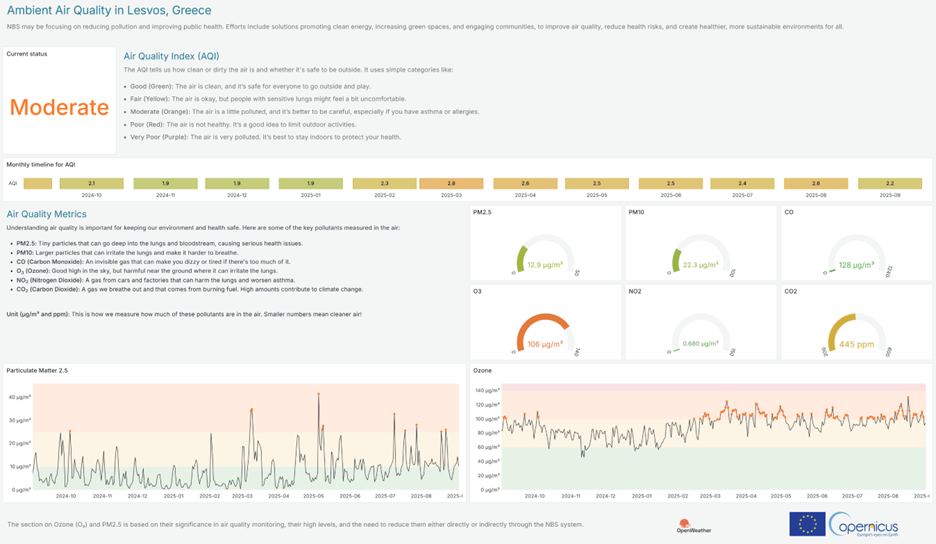
Figure 3: Air Quality
Focusing on key pollutants (PM2.5, PM10, NO₂, O₃), this dashboard visualises trends and thresholds, enabling:
- Monitoring of pollutant levels and health risk alerts.
- Identification of pollution spikes or patterns.
These insights support public health awareness and highlight how local NBS help improve air quality in tangible ways.
Why This Matters: Connecting Data, Nature, and Community
By delivering accessible dashboards on the same platform, CARDIMED Insights:
- Promotes transparency and trust in public services.
- Empowers citizens to participate in local climate action and to understand, question, and contribute to environmental well-being.
- Supports local resilience through data-informed NBS implementation.
Looking Ahead
The dashboards presented in this article are part of the initial version of the CARDIMED Insights hub. As the CARDIMED project progresses, the Insights platform will continue to grow. Additional dashboards will be integrated, highlighting the impact of NBS across multiple DEMOs and regions.
The platform will also feature data stories that illustrate the real-world benefits of NBS implemented at different DEMO sites.
Stay tuned as we expand the platform’s reach and keep transforming complex data into clear, actionable insights for the communities that need them most.